|
Mercury Porosimetry – A Critical Review Of Calculation Procedures
Test Protocol
1. The clean dry sample is weighed and placed in the bulb of a penetrometer selected so that the pore volume of the sample is closely matched to the volume of the penetrometer stem.
2. The sample and penetrometer are weighed together.
3. The penetrometer containing the sample is loaded into the low-pressure chamber of a Micromeritics Autopore IV porosimeter.
4. The penetrometer is evacuated to a pressure of less than 50 um of mercury, and then filled with mercury at a pressure of 1.5 psia. The volume of the mercury present in the penetrometer is subsequently used to calculate the sample bulk volume.
5. Mercury is injected into the sample at increasing incremental pressures from 1.5 to 30.0 psia, using nitrogen gas as the displacing medium.
6. At each pressure increment, mercury intrusion is monitored while the pressure is held constant. Equilibrium is identified when the rate of intrusion drops below 0.001 uL/g-sec. The pressure and the total volume for each point are recorded.
7. On completing the 30 psi injection increment, the low pressure stage is complete and the injection pressure is reduced to atmospheric and the penetrometer is removed and weighed with the sample and mercury in place (the assembly weight). The assembly weight is used to calculate the sample bulk volume.
8. The sample is then loaded into the high-pressure chamber of the Autopore IV system.
9. The system pressure is increased to 30 psi. Mercury is then injected into the sample at increasing incremental pressures from 30 to 60,000 psia, using hydraulic oil as the displacing medium.
10. The data acquisition process proceeds as described in item 6 above.
11. On completing the 60,000 psi injection increment, the high pressure stage is complete, the injection pressure is reduced to atmospheric and the penetrometer is removed, completing the test. Alternatively, an imbibition cycle can be performed. In this case the system pressure is decreased in increments from 60,000 psi down to atmospheric pressure and incremental mercury extrusion for the sample recorded, suing the same stabilisation criteria as described in item 6 above.
Note: The pressure increments at which data is acquired are contained within a pressure table which can be selected to suit the properties of the material under examination.
Data Reduction
The following discussion focuses upon the basic measurements which are used to calculate porosity from the mercury injection, Autopore IV apparatus, and how errors can be made, the significance of each source of error and thus the areas in which measurement error must be minimised are identified. The mercury porosimeter provides much data in addition to basic intrusion volume, however, porosity (total void space within a porous medium as a fraction of bulk volume) is a vital and critical measurement and is the subject of this discussion. For the purposes of the discussion, we will also make the assumption that the mercury pore volume has been measured correctly, in terms of machine calibration, penetrometer calibration etc.
Mercury injection pore volume is reported by the Autopore IV as a cumulative volume of mercury injected into the sample void space, at the maximum injection pressure of 60,000 psi. The injection is reported in cc. per gram (or ml./g.) and thus must be multiplied by the total sample weight to obtain the total volume of mercury injected – the mercury pore volume.

Thus we have established one of the fundamental parameters upon which subsequent calculations are based. In order to convert the pore volume into an measure of the measured void space of the sample under test (the porosity), we must now establish what the total sample volume is – termed the bulk volume. The porosity is then the fraction of the total sample pore volume that is occupied by void space (pore volume).
The calculation of bulk volume can be performed by two methods. The commonest procedure as adopted by most core analysis laboratories relies upon the use of a grain density (termed a skeletal density in some instances) measured upon the test sample using helium. The grain density is the density of the solid fraction of the sample (grains, cement etc.) expressed in grams per cc. (g/cc.), and will reflect the average of the densities of the component minerals, which may themselves have a wide range of densities. Pure rock types, will reflect the density of their dominant component – e.g. sandstone (quartz 2.65 g/cc), limestone (calcite 2.71 g/cc). Rocks containing small amounts of minerals with extreme density values, such as pyrite (4.95 g/cc) may deviate significantly form the expected values, though the cause may not easily be detected visually due to their small volumetric presence.
Core analysis labs measure the sample grain density using a helium pychnometer, where a sample chamber of known volume is connected to a reference chamber of known volume. Using Boyle’s law it is possible to determine the grain volume of the test sample and then the grain density. The calculations procedure is as follows:
The grain volume is used to determine the bulk volume.
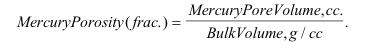
This provides all the necessary information required to calculate the mercury porosity.
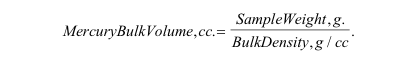
Alternatively, the porosity can be derived purely from measurements performed by the Autopore IV. During the mercury intrusion procedure the volume of the whole sample is determined, the bulk volume. In fact the machine reports a bulk density which is the density of the solid fraction of the sample (grains / cement etc.) and the pores (which are assumed to be air filled and therefore effectively have no weight. For a sample with zero measurable porosity, the bulk density = grain density. As the porosity increases, the bulk density decreases progressively, thus a sandstone (grain density of 2.65 g/cc) would have a bulk density of 2.39 g/cc. (10% porosity), 2.12 g/cc (20% porosity) or 1.86 g/cc (30% porosity) as examples.
The bulk density is calculated from the weights and volumes of the various components of the system – the penetrometer, the sample etc. as per the formula that follows:
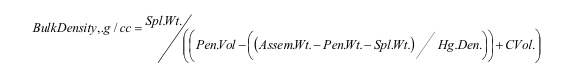
Where: Sample Weight, g.
Penetrometer Volume, cc.
Assembly Weight, g.
Penetrometer Weight, g.
Hg density, g/cc.
Conformance Volume, cc.
To summarise this equation the volume of the empty penetrometer is known from calibration. At the point at which the bulk density is measured, the volume of the penetrometer is entirely filled with mercury except for the volume of the sample. Thus by weighing the entire assembly, subtracting all weights shown and subtracting the equivalent volume of mercury form the penetrometer volume, this leaves the sample volume (this is converted to bulk density by dividing into the sample volume).
A correction to the bulk volume is required in terms of the Conformance Volume of the sample. The Autopore IV is programmed to assume that at 1.5 psi injection pressure, the mercury has completely enveloped the sample but that no injection has occurred. For our purposes, neither of these assumptions may be true. In very porous and permeable samples some injection may occur by 1.5 psi – this is uncommon but cannot be discounted. All samples are surrounded by a zone of surface roughness and irregular exposed pore surfaces. As the injection pressure increases, the surface layer will become filled with mercury and at some point the mercury will enter the largest pore throats and fill the largest pores – the entry pressure. This is apparent in a change in slope of the plot of cumulative injection against injection pressure. The volume of mercury recorded by the Autopore IV at the manually selected entry pressure is the conformance volume. The Autopore IV begins recording injection at the first pressure point above 1.5 psi injection pressure at which “apparent” injection begins. This apparent injection is not part of the pore volume and until the entry pressure is exceeded all apparent injection must be added back onto the sample volume as it will otherwise be not accounted for. Entry pressure may occur at anything from 1.5 psi (or less) up to many hundreds of psi – in such a case the mercury would conform to the sample surface at a lower pressure, but little further apparent injection would occur until the entry pressure is exceeded.
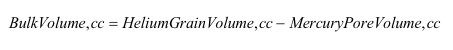
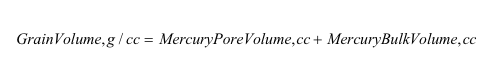
The corrected bulk volume having being correctly calculated, this can be added to the Autopore IV calculated pore volume to obtain the bulk volume:
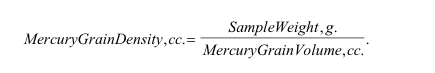
The grain volume is now calculated:
The grain density:
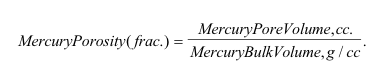
The mercury injection porosity:
Summary
We have seen that porosity from mercury injection can be calculated by two procedures. The use of grain density from helium pychnometry is used as standard by core analysis laboratories. Whilst the calculation is straight forward, there is considerable opportunity for potential error in measuring grain density on a small sample, and it combines measurements from different techniques. The use of bulk density from the Autopore IV requires careful correction of the bulk density. However all measurements originate from the same instrument and the sample size is optimal for an accurate determination of bulk density. If all measurements can be made from the same instrument, this is the preferred calculation method employed, although it is useful to calculate a porosity from helium grain density (if available) as a verification check. There are various factors that can cause porosity and grain density to vary between mercury and helium to deviate significantly, regardless of measurement accuracy, however, typically, it is possible to obtain a good match which will increase the level of confidence in the data. In either case, the mercury porosity is based upon the assumption that the sample pore volume is completely mercury saturated at 60,000 psi.
Mercury Pore Volume
Porosity determined by helium often exceeds the value measured by mercury injection. In some cases, the variation is minimal whilst in others in can be considerable, giving rise to concerns with regard to the integrity of the experimental procedure. The source of errors in any measurement performed can be divided into two categories – experimental errors (measurement) and those due to limitations of the measurement technique.
Experimental errors associated with mercury injection which would result in erroneous pore volume could occur from a number of sources such as incorrect instrument calibration, selection of incorrect calibration files, incorrect sample weight input or instrument malfunction. All these errors are minimised by implementation of rigorous laboratory procedures, regular instrument calibration and careful measurement of the test sample properties. The resultant measured pore volume by mercury injection should be within 1% of the actual volume compared to standard reference material of known porosity. In any case, errors originating from this source would be likely to be gross errors, clearly erroneous, or random and not biased towards a consistent underestimation of pore volume compared to the helium pore volume.
Limits of the experimental technique are associated with the measurement of pore volume that is isolated (not connected) or is accessed via pore throats that are smaller than the minimum that can be accessed by mercury at the maximum measurement pressure of 60,000 psi (<0.003 um). Thus in samples where there is a significant level of microporosity or isolated porosity, porosity from mercury injection will be consistently low compared to the helium measurement. Helium is considered to access all void space (pore volume) and therefore will give a maximum value - a true or effective porosity. In cases where this is little isolated porosity or microporosity, there will be good agreement between the two techniques. In either case, the mercury injection procedure will provide an accurate measurement of the volume of pore space that is associated with fluid transport and storage in the reservoir. Isolated porosity and microporosity will not effectively contribute to either of these. The pore throat size distribution and air/mercury capillary pressure data also correctly represents the sample properties, not withstanding the considerations that apply to mercury injection measurements (such as zero wetting phase saturation).
|
